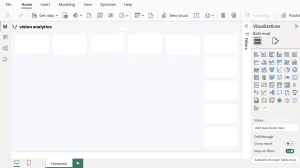
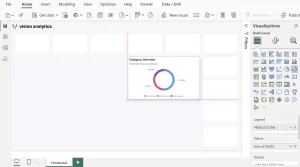
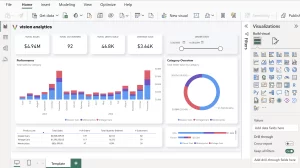
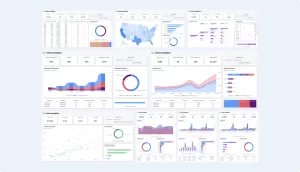
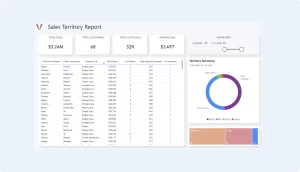
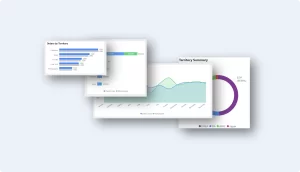
Dashboard Design in Power BI Just Got Easy. Download our Templates or use the Vision Toolkit to create impressive and easy to use reports in Microsoft Power BI. View Pricing Preview Toolkit Features 10 Power BI Templates Fully-Built Power BI Report Templates 100+ Custom Visuals Customized charts, maps, and KPIs Canvas Blueprint The perfect starting point to build from See All Features -> Say Goodbye To Design Hassle Unlock the full potential of your data with our premium Power BI templates and visual components.Our designs ensure that you can focus on your data analysis without the hassle of designing from scratch.Say goodbye to the complexities of visualization design and hello to compelling reports. Learn more Standardize Your Reporting Embrace consistency and efficiency in your data reporting with our Power BI templates and visual components.Our Toolkit is designed to streamline your reporting process, ensuring uniformity across all your reports. View templates Get Straight To The Bottom Line Our custom visuals will bring your data story to life.A user-centric layout and engaging visuals will highlight the trends and bring the insights to light. View pricing How it Works 01 Select a Blueprint Choose from landscape or portrait dashboard blueprints. 02 Copy and Paste Components Pick the visuals from the Toolkit and paste them in. 03 Connect your data Connect your data and let the magic happen. Blog Posts Top-10 Dashboard Examples View our top dashboard designs and examples Dashboards Make The Best Reports How you can use Power BI to replace your Excel reports Beyond Flatland: The Rise of 3D Effects The trend towards 3D visuals is starting to take hold Buy once, use forever. 30-Day Money-Back Guarantee. Early Access Individual Tailored for analysts and engineers committed to elevating their design game. $29 one-time payment 10 Power BI Templates 100+ Custom visuals 10 Themes 1 Canvas Blueprint Unlimited Downloads Buy now Enterprise Complete Solution: We build, you gain data-driven insights. Power BI integration and design Free access to the Toolkit Data strategy consultation Ongoing support Contact