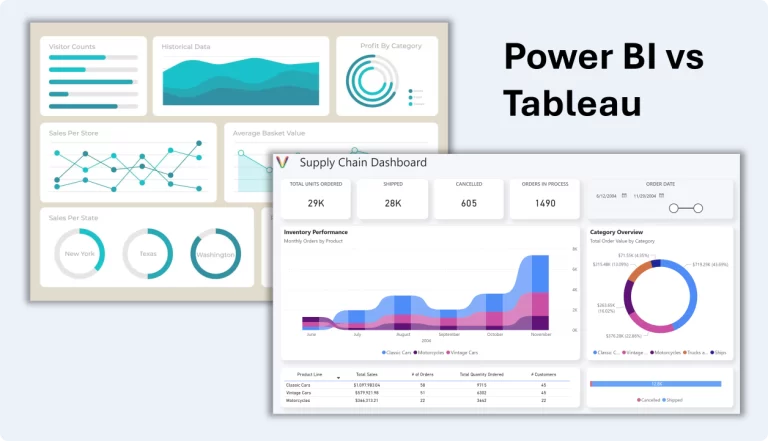
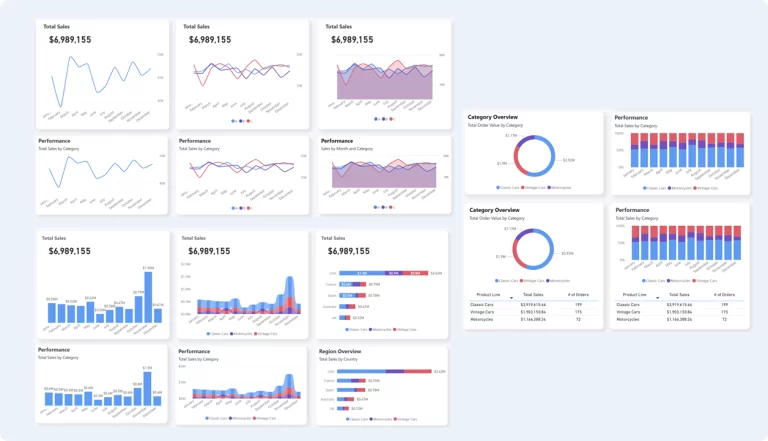
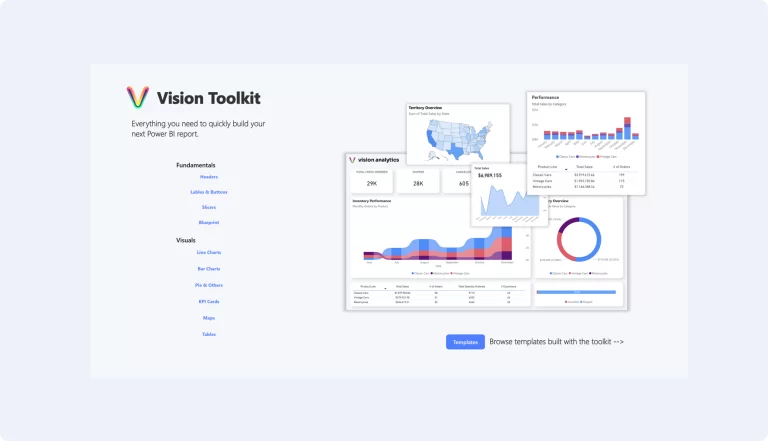
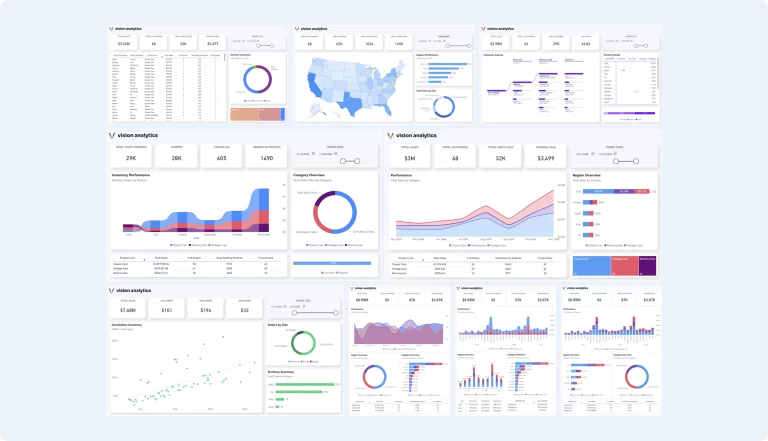
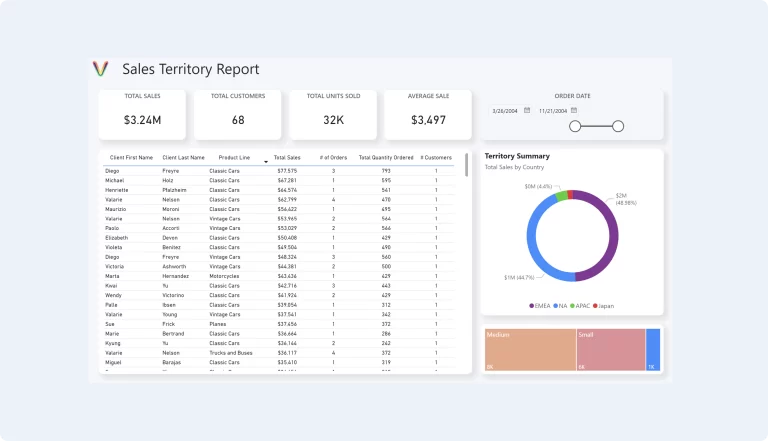
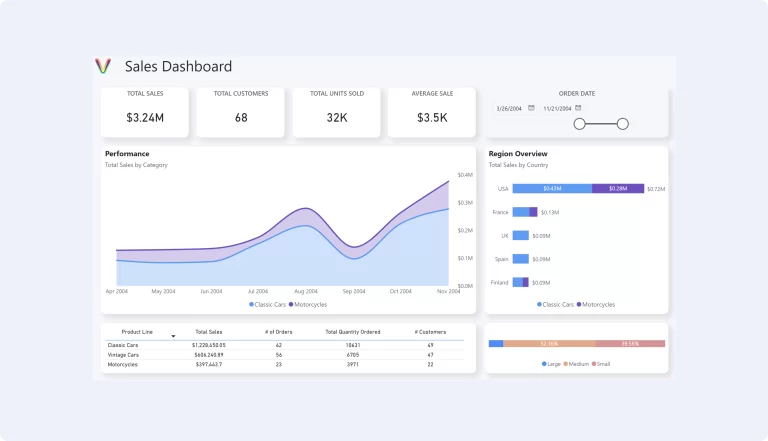
Unlock the Full Potential of Your Data with Our Top Power BI Templates

Introduction In today’s data-driven world, the ability to quickly analyze and visualize data is crucial for making informed decisions. Power BI, Microsoft’s interactive data visualization tool, offers extensive capabilities to transform raw data into compelling insights. However, starting from scratch can be time-consuming and often requires advanced knowledge of data analytics. That’s where our Power […]

Unlock the Full Potential of Your Data with Our Top Power BI Templates Read More »

How in the world do I get my company off of Excel reports?

In today’s fast-paced business environment, the need for real-time data and interactive reporting cannot be overstated. While Excel has been a staple in data management for decades, tools like Power BI and Tableau are transforming the landscape of business intelligence (BI). This transition not only enhances data visualization but also boosts decision-making efficiency. Here’s a

How in the world do I get my company off of Excel reports? Read More »

Top 10 Power BI Dashboard Examples

What Makes an Exceptional Power BI Dashboard? Tailored to Your Audience Great dashboards reflect the needs of their specific audience. Whether they provide real-time data for day-to-day operations or strategic insights for C-level decisions, the best dashboards are always audience-centric. Simplicity is Key Avoid the clutter. A well-thought-out dashboard strikes a balance between simplicity and

Top 10 Power BI Dashboard Examples Read More »

Dashboards Make The Best Reports

In the ever-evolving landscape of business intelligence and data analysis, Microsoft Power BI templates are emerging as game-changers. These templates are not just tools; they are gateways to insights, efficiency, and empowerment. As we pivot from the familiar grounds of Excel reporting, let’s explore how Power BI templates are setting the new standard for self-service

Dashboards Make The Best Reports Read More »

Beyond Flatland: The Rise of 3D Visual Effects in Dashboard Design

3D visual effects on dashboards are indeed gaining in popularity, as part of a broader trend towards making data visualization more engaging and insightful. This increase in popularity is driven by several factors: 1. Enhanced Data Representation 3D visual effects can provide a more nuanced view of complex data sets, allowing users to understand the

Beyond Flatland: The Rise of 3D Visual Effects in Dashboard Design Read More »

Good Dashboard Design Is Your Friend

In today’s data-driven landscape, dashboards are essential tools for synthesizing complex information and providing actionable insights. Whether it’s for tracking sales, monitoring supply chain activities, or understanding customer behavior, a well-designed dashboard can transform decision-making processes. However, creating an effective dashboard requires more than just compiling data; it demands thoughtful design and strategic planning. Here,

Good Dashboard Design Is Your Friend Read More »

Scroll to Top