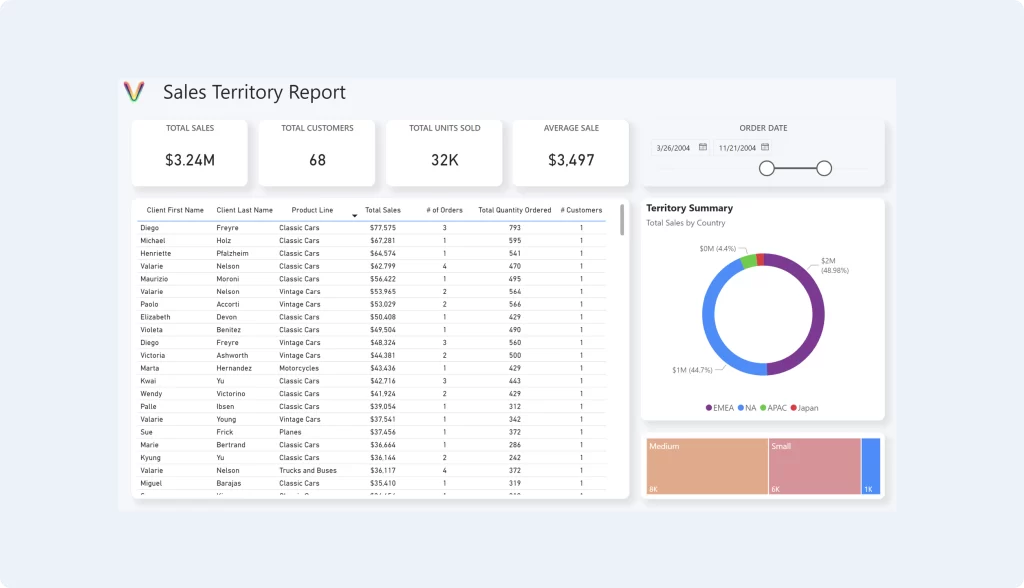
In the ever-evolving landscape of business intelligence and data analysis, Microsoft Power BI templates are emerging as game-changers. These templates are not just tools; they are gateways to insights, efficiency, and empowerment. As we pivot from the familiar grounds of Excel reporting, let’s explore how Power BI templates are setting the new standard for self-service reporting.
Understanding the Shift
Excel has been the go-to for countless organizations for years, offering a familiar platform for data analysis and reporting. However, as data becomes more integral to decision-making, the limitations of Excel become apparent—enter Power BI templates.
Power BI Templates: The New Era of Reporting
Power BI templates provide pre-built reporting frameworks that users can customize with their data. These templates leap beyond Excel’s capabilities, offering:
1. Advanced Data Visualization
While Excel excels in spreadsheets, Power BI templates bring data to life with interactive and compelling visualizations. Users can quickly grasp complex insights without sifting through rows and columns.
2. Integration and Connectivity
Power BI templates connect seamlessly to various data sources, including those beyond Microsoft’s ecosystem. This integration capability surpasses Excel’s more manual data handling, offering a more dynamic data experience.
3. Scalability
Excel struggles with large datasets, leading to performance issues. Power BI templates are designed to handle vast amounts of data efficiently, ensuring your analytics can grow with your business needs.
4. Real-Time Analytics
Unlike Excel, Power BI templates can refresh data in real-time. This means users always have access to the latest information, enabling timely and informed decision-making.
The Perfect Place for Self-Service
One of Power BI’s strengths is its user-friendly interface, making it accessible for non-technical users. Here’s how Power BI templates are the perfect place for self-service:
Empowering Users
With templates, users don’t need to start from scratch. They provide a foundation upon which users can build custom reports, fostering a sense of ownership and empowerment.
Reducing Dependency
By enabling non-technical users to create their reports, organizations can reduce their dependency on IT departments for data analysis, streamlining the decision-making process.
Enhancing Collaboration
Power BI’s sharing capabilities far outstrip Excel’s, making it easier for teams to collaborate on data analysis and reporting, regardless of their location.
Making the Transition
Transitioning from Excel to Power BI templates doesn’t have to be daunting. Here are a few tips:
• Start Small: Begin with a single report or dataset to understand the process.
• Leverage Training Resources: Microsoft and other platforms offer extensive training materials to ease the learning curve.
• Seek Feedback: Encourage users to share their experiences and suggestions for improvement.
Conclusion
As the business world becomes increasingly data-driven, the shift from Excel to Power BI templates is not just inevitable; it’s essential. These templates offer a more robust, efficient, and user-friendly approach to self-service reporting. Embrace the change, and let Power BI templates transform your data analysis journey from standard to stellar.
This blog structure emphasizes the advantages of Power BI templates while providing actionable advice for businesses ready to make the leap from Excel reporting. Tailoring the content to highlight your unique templates and how they address common pain points could further enhance its effectiveness.
Download a Free Power BI Template
Get a head start on your next Power BI project with a free template and canvas blueprint.
