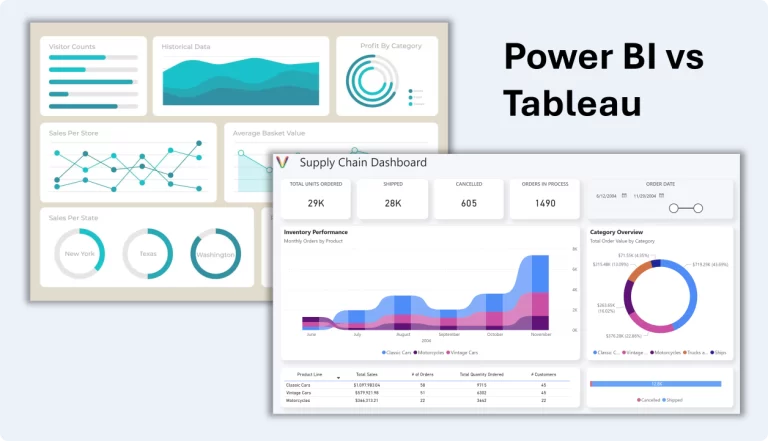
Top 10 Reasons Why Power BI is Better Than Tableau
When it comes to data visualization and business intelligence tools, Power BI and Tableau are two of the most popular choices. While both platforms offer powerful analytics capabilities, Power BI has a significant edge in various aspects. In this article, we’ll explore the top 10 reasons why Power BI is the superior choice for businesses and data professionals.
1. Cost-Effectiveness
Power BI is considerably more affordable than Tableau. Power BI offers a free version with substantial features, while Power BI Pro costs just $10 per user per month. In contrast, Tableau’s licensing fees can be significantly higher, making Power BI the budget-friendly option. (Learn more about Power BI pricing here.)
2. Seamless Integration with Microsoft Ecosystem
Power BI integrates natively with Microsoft tools such as Excel, SharePoint, Azure, and Teams, making it the best choice for businesses already using Microsoft products. Tableau requires additional steps to connect with Microsoft tools, making integration less seamless. (Check out our Power BI templates that leverage these integrations here.)
3. User-Friendly Interface
Power BI is designed for both technical and non-technical users, offering an intuitive drag-and-drop interface. Tableau, while powerful, has a steeper learning curve, requiring more time to master.
4. Built-In AI and Machine Learning
Power BI includes AI-powered features such as Quick Insights, Azure Machine Learning integration, and cognitive services. These tools enable users to automate data analysis and generate insights effortlessly. Tableau requires third-party integrations for similar AI functionalities. (Read more about Power BI’s AI capabilities here.)
5. Stronger Data Connectivity
Power BI provides extensive data connectivity options, including native connections to SQL Server, Excel, SharePoint, and a vast range of cloud services. While Tableau also supports many connectors, Power BI’s seamless integration with Microsoft data sources gives it an advantage.
6. Better Customization and Embedded Analytics
With Power BI, users can easily customize reports and embed interactive visuals in apps, websites, and Microsoft Teams. Power BI’s embedding capabilities make it an excellent choice for organizations looking to integrate analytics into their existing workflows. (Check out our custom Power BI templates here.)
7. Superior Data Security
Power BI benefits from Microsoft’s robust security framework, including Azure security protocols, role-based access control, and data encryption. These features make Power BI a trusted choice for enterprises with strict security requirements. (Learn about Power BI’s security features here).
8. More Frequent Updates and Enhancements
Microsoft releases monthly updates for Power BI, continuously improving features, adding new functionalities, and enhancing performance. Tableau’s update cycle is slower, making Power BI a more dynamic and evolving tool. (Check out Power BI’s latest updates here.)
9. Better Scalability for Large Enterprises
Power BI Premium offers dedicated cloud resources, ensuring optimal performance for large-scale data processing. Tableau’s licensing model can be expensive for organizations that need enterprise-level scalability, making Power BI the better option for growing businesses.
10. Community and Support
With Power BI being part of Microsoft’s ecosystem, users benefit from a vast community, extensive documentation, and direct support from Microsoft. The Power BI community forum and Microsoft Learn provide valuable resources for troubleshooting and learning. (Join the Power BI community here.)
Conclusion
While Tableau is a strong competitor, Power BI’s affordability, ease of use, AI capabilities, security, and seamless Microsoft integration make it the best choice for most businesses. If you’re ready to take your Power BI experience to the next level, check out our professionally designed Power BI templates at Vision Analytics.