Access Custom Power BI Templatesā
Get instant access to 10 professionally designed Power BI templates built for real-world business needsāsales, finance, marketing, operations, and more. Each template is fully customizable and optimized for speed, clarity, and visual impact.
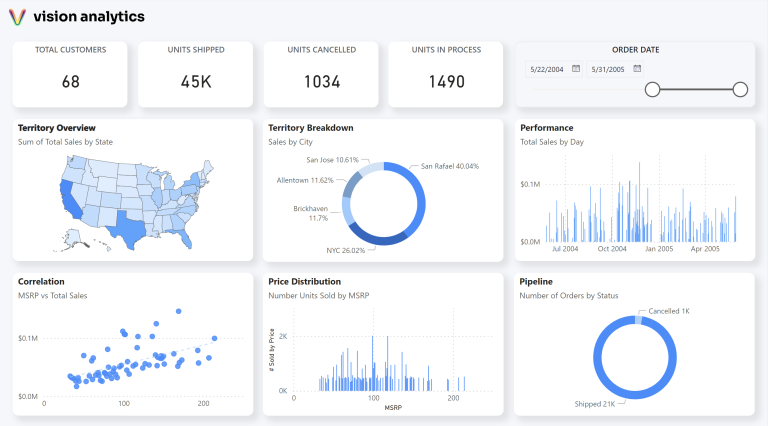
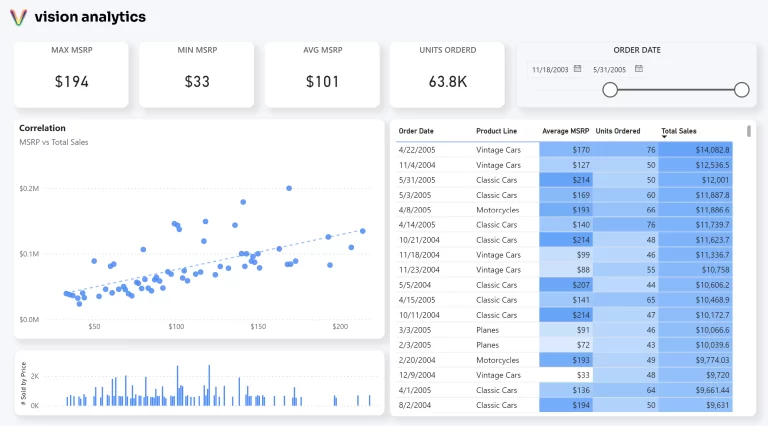
Built using theĀ Vision Toolkit
Restaurant Owner Power BI Template: Track Food Consumption
How much spaghetti I ate in a year. Just a fun visualization that you can draw inspiration from. Track food consumption over time and uncover weekly trends.
Sales Manager Power BI Template: Track Performance and Sales Metrics
High level overview of sales for middle to senior level managers. Track sales team performance by region and product type.
Global Logistics Power BI Template: View Regional Sales and Inventory Metrics
A global logistics report provides a comprehensive overview of logistics operations on a worldwide scale, offering insights into various aspects of the supply chain and distribution networks.
Supply Chain Analyst Power BI Template: Track Inventory Levels
A supply chain report provides a comprehensive view of the key metrics and performance indicators relevant to managing and optimizing the supply chain.
Sales Report Power BI Template: View Sales Trends Quickly
A sales report is an invaluable tool for visualizing key performance indicators and insights related to sales activities.
Sales Detail Power BI Template: Grid View of Important Sales Metrics
Replace your excel reporting with interactive reports. These reports are setup to be fully self-serviceable for the members in your organization.
Sales Trends Power BI Template: View Sales Insights
A sales trendsĀ report is an invaluable tool for estimating and forecasting futures values. These insights lead to new KPIs and strategies.
Customer Funnel Power BI Template: Tree Diagram Shows Client Journey
Tree Diagrams are great for showing how a customer can flow through a sales or marketing journey. These reports allow to you spot bottlenecks and improve lead conversion.
C-Suite Power BI Template: High-Level Overview
An executive report needs to be high-level. The C-Suite needs to look at something quickly and get the big picture. Maps are key in this example.
Correlation Power BI Template: Highlight The Relationships
Scatter Plots are great for showing how two different data points are related. The relationship between price and quantity is a great example to understand how elastic customer demand is.
Buy once, use forever.
30-Day Money-Back Guarantee.
Get Instant Access
$10
Tailored for analysts and engineers committed to elevating their design game.
- 10 Power BI Templates
- 100+ Custom Visuals
- 10 Custom Themes
- 1 Canvas Blueprint
- Unlimited Downloads
10 Power BI Templates
Fully-Built Power BI Report Templates
100+ Custom Visuals
Customized charts, maps, and KPIs
Canvas Blueprint
The perfect starting point to build from
